Let's Collaborate
I'm always happy to empower people with technology. Here's what I bring to the table and what I'm looking for.
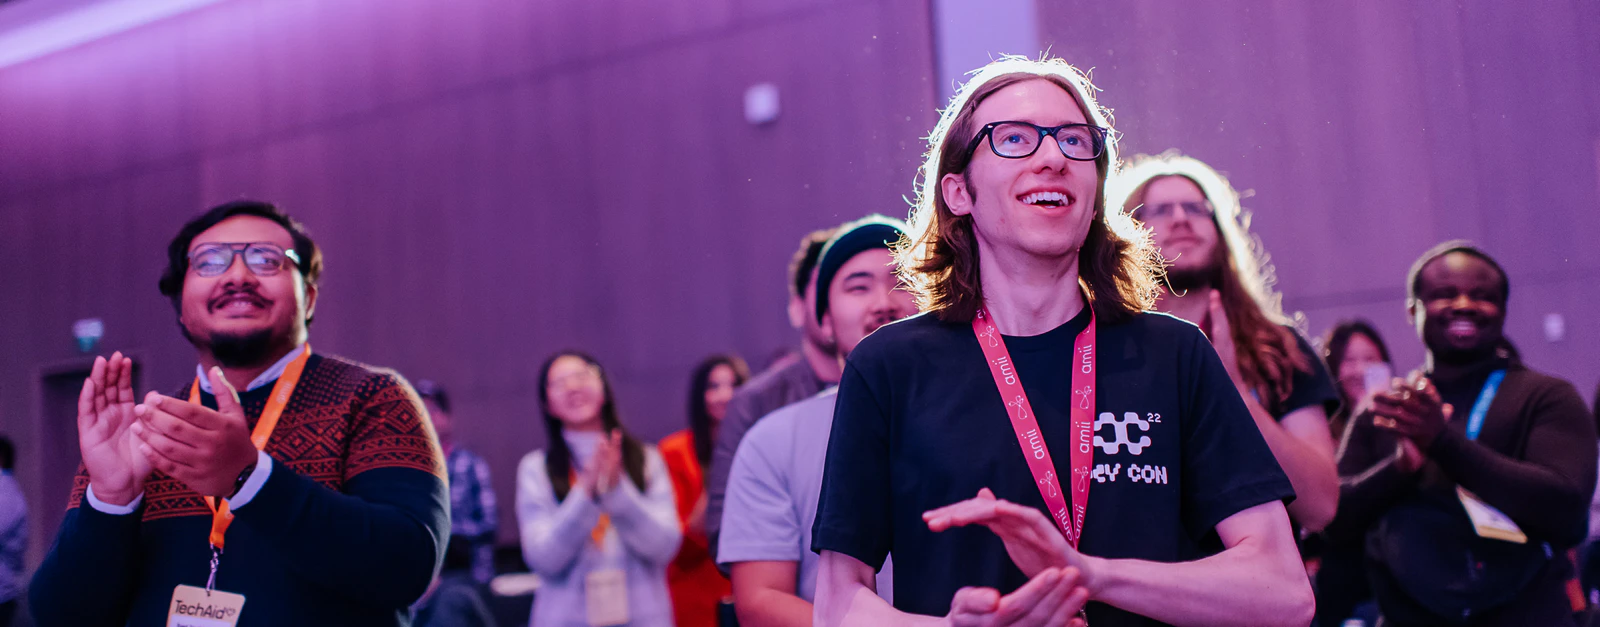
Audience participation at my talk at TechAid 2022, the Alberta Machine Intelligence Institute's AI conference
What I Offer
I combine a fluency with technical expertise (full-stack + product development, data, AI, visualization), empathy-driven design, and a love of impressing others (or helping them do the same) to create solutions and craft talks. I translate deep subject matter expertise (my own and/or others) and non-technical perspectives into products, conversations, and decision-making.
All of that makes creating digital experiences feel natural, as does collaborating with others. I'm comfortable with uncertainty and incomplete information. I'm also patient and pragmatic with bureaucracy.
What Excites Me
I'm drawn to projects that have real impact and where I can work with great teams. I'm also interested in contributing to national and international initiatives. And I genuinely enjoy giving highly rated talks and workshops.
Projects/Opportunities
Impact and Great Teams
That is genuinely my main criteria for prioritizing and accepting projects. Impact is hard to quantify. It might be a tool that reaches thousands, or work that helps someone make critical decisions. And I've said yes to opportunities simply because I admired the team or the organization behind them.
Incomplete List of Things I Already Have Interests In:
- Digital cave / giant wall visualizations, got a few ideas
- Explainable AI, enjoyed this in my MSc
- Civic good visualizations, I keep saying yes to these
- Creating viral visualizations
- A viz for the Red Cross: If you know someone, would appreciate a connection!
Civic Good
National and Global Initiatives
I've really enjoyed my experiences with board and committee positions, most recently with Canada's Multi-Stakeholder Forum on Open Government. The opportunity to directly influence the prioritization and execution of projects that can impact people across the country feels very meaningful.
If you think there's a board, committee, or advisory role that would be a fit, please let me know! I take these roles seriously and my peers on them will attest to the effort I bring.
If you're curious my Resumé outlines my volunteering efforts over the years.
Talks & Workshops
I love giving fun, visual, and engaging talks and workshops. I've done so at various post-secondary institutions, international and government conferences on topics like data visualization, AI, and open data. Technical talks can sometimes get dense, so I try my best to make mine clear, accessible, and engaging.
On several separate occasions, without any prompting, attendees have come up to tell me my talk was their favourite of the conference.
I also enjoy giving non-technical, soft-skill talks to technical audiences. I used to have a major fear of public speaking, but I leaned into it because those skills are incredibly valuable in technical fields (...and they can greatly improve GPAs). I share what I've learned, including insights from communicating through data visualization, with examples that resonate with the specific audience.
Get in Touch
Have a project in mind? Want me to give a talk, run a workshop, or join a panel?
Drop me an email at [email protected]